14/01/2023

Footprint Analytics and build some NEAR statistics

 Footprint Analytics and build some NEAR statistics

About this topic:

This topic is about how to use Flipside to build some NEAR blockchain statistics

Footprint Analytics link: https://www.footprint.network/

To learn more about NEAR blockchain, visit https://polygon.technology/.

NEAR price

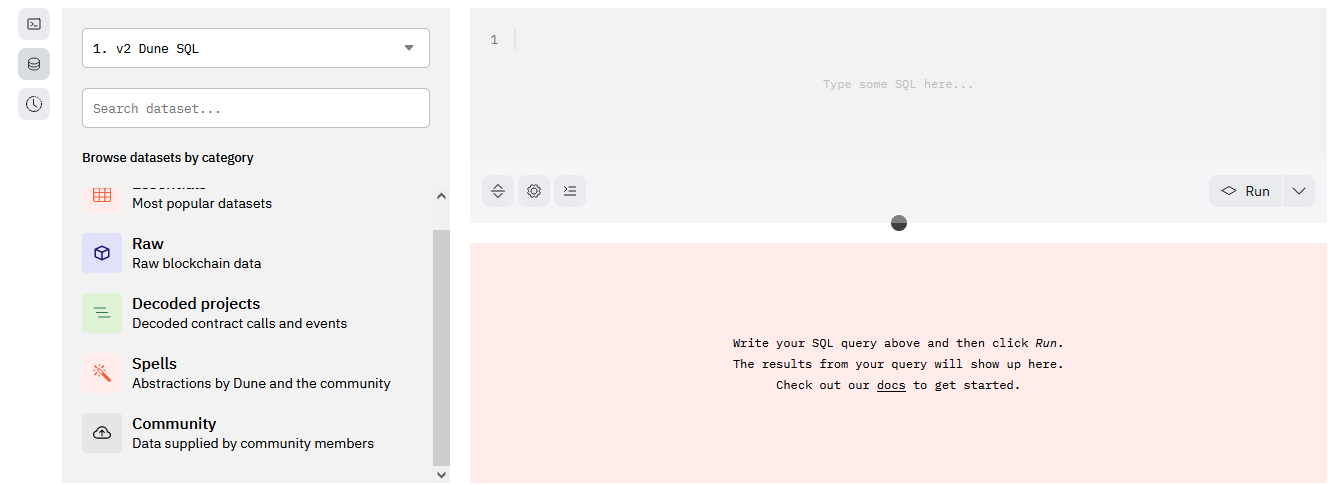
How do I find a suitable table for this query?

by using search

We will search for tables and select the required table.


By clicking on the table we want, we can browse and display the fields in it.

Now back to NEAR price

The suggested SQL statement is the following:


SELECT date("footprint"."token_daily_stats"."on_date") AS "time", 

sum("footprint"."token_daily_stats"."price") AS "price"

FROM "footprint"."token_daily_stats"

WHERE "footprint"."token_daily_stats"."token_symbol" = 'NEAR'

GROUP BY date("footprint"."token_daily_stats"."on_date")

ORDER BY date("footprint"."token_daily_stats"."on_date") ASC


After adding the query, a graphic form can be added based on it.

NEAR TVL

The suggested SQL statement is the following:

SELECT date("footprint"."defi_protocol_daily_stats"."on_date") AS "time", sum("footprint"."defi_protocol_daily_stats"."tvl") AS "tv"
FROM
"footprint"."defi_protocol_daily_stats"
WHERE "footprint"."defi_protocol_daily_stats"."chain" = 'Near'
GROUP BY date("footprint"."defi_protocol_daily_stats"."on_date")
ORDER BY date("footprint"."defi_protocol_daily_stats"."on_date") ASC


NEAR market cap

The suggested SQL statement is the following:

SELECT date("footprint"."token_daily_stats"."on_date") AS "time", sum("footprint"."token_daily_stats"."market_cap") AS "market_cap"
FROM
"footprint"."token_daily_stats"
WHERE ("footprint"."token_daily_stats"."token_symbol" = 'NEAR'
AND "footprint"."token_daily_stats"."on_date" >= CAST('2021-01-02 00:00:00Z' AS timestamp with time zone))
GROUP BY date("footprint"."token_daily_stats"."on_date")
ORDER BY date("footprint"."token_daily_stats"."on_date") ASC


NEAR TVL period

The suggested SQL statement is the following:

SELECT date("footprint"."defi_protocol_daily_stats"."on_date") AS "time", sum("footprint"."defi_protocol_daily_stats"."tvl") AS "tv"
FROM
"footprint"."defi_protocol_daily_stats"
WHERE "footprint"."defi_protocol_daily_stats"."chain" = 'Near'
GROUP BY date("footprint"."defi_protocol_daily_stats"."on_date")
ORDER BY date("footprint"."defi_protocol_daily_stats"."on_date") ASC


NEAR market cap period

The suggested SQL statement is the following:

SELECT date("footprint"."token_daily_stats"."on_date") AS "time", sum("footprint"."token_daily_stats"."market_cap") AS "market_cap"
FROM
"footprint"."token_daily_stats"
WHERE ("footprint"."token_daily_stats"."token_symbol" = 'NEAR'
AND "footprint"."token_daily_stats"."on_date" >= CAST('2021-01-02 00:00:00Z' AS timestamp with time zone) AND "footprint"."token_daily_stats"."on_date" >= date(date_add('day', -360, now())) AND "footprint"."token_daily_stats"."on_date" < date(now()))
GROUP BY date("footprint"."token_daily_stats"."on_date")
ORDER BY date("footprint"."token_daily_stats"."on_date") ASC


Now build a dashboard.


We can build dashboards.


Just add the queries to the dashboard and coordinate and arrange.

12/01/2023

Flipside and build some Polygon statistics

 Flipside and build some Polygon statistics.

About this topic:

This topic is about how to use Flipside to build some Polygon blockchain statistics

Flipside link: https://flipsidecrypto.xyz/

To learn more about Polygon blockchain, visit https://polygon.technology/.

Polygon transactions by day

How do you find a suitable table for this query?

By using Explore Data, we will choose Polygon

 We will search for tables and select the required table.

By clicking on the table we want, we can browse and display the fields in it.

 Now back to Polygon Transactions Day.

The suggested SQL statement is the following:


SELECT

date_trunc('day', block_timestamp) as day

COUNT(DISTINCT tx_hash) as transactions_count

FROM polygon.core.fact_transactions

WHERE day >= CURRENT_DATE - 90

GROUP BY 1


 We will work on the polygon.core.fact_transactions table and make the query for 90 days only.

After adding the query, a graphic form can be added based on it.


Polygon addresses day

The suggested SQL statement is the following:


SELECT

date_trunc('day', block_timestamp) as day

COUNT(DISTINCT from_address) as unique_addresses

FROM polygon.core.fact_transactions

WHERE day >= CURRENT_DATE - 90

GROUP BY 1


Polygon gas price

The suggested SQL statement is the following:

select date_trunc('day',block_timestamp) as day,
Avg(gas_price) as gas_price
From
polygon.core.fact_transactions
Where day >= CURRENT_DATE - 90
Group by 1 Order by 1 asc


Polygon fees last 3 months.

The suggested SQL statement is the following:

select sum(tx_fee) as fee_tx
from
polygon.core.fact_transactions
where block_timestamp >= CURRENT_DATE – 90

Polygon fee day

The suggested SQL statement is the following:

select date_trunc('day', block_timestamp) as day, sum(tx_fee) as fee_tx
from
polygon.core.fact_transactions
where day >= CURRENT_DATE - 90
group by 1

Now build a dashboard.

We can build dashboards.


Just add the queries to the dashboard and coordinate and arrange.


10/01/2023

Dune analytics and build some Ethereum statistics

Dune analytics and build some Ethereum statistics

About this topic:

This topic is about how to use Dune Analytics to build some Ethereum blockchain statistics.

Dune Analytics link: https://dune.com/home

To learn more about the Ethereum blockchain, visit https://ethereum.org/en/.

Ethereum Price

How do you find a suitable table for this query?

 from this screen

By using spells and writing "price"

When you press "price" you can find these tables:

When we press "usd" table, we can find these fields in this table.

By clicking on "View" we can view all fields in the table.

Also, by writing a query statement,

Through it, we can view all the fields in the table.

We can apply this method to any other table.

First, we search through tables to find tables that can help us create the queries we need.

Then the next step is to explore the fields in these tables.


Query  With SQL statements like this, we can explore the fields in several tables that help us achieve our goals.


SELECT * FROM ethereum.transactions LIMIT 5

 SELECT * FROM ethereum.traces FETCH FIRST 3 ROWS ONLY

SELECT * FROM prices.usd FETCH FIRST 3 ROWS ONLY

 SELECT * FROM ethereum.blocks LIMIT 5


Now that we want to build a query to extract the Ethereum price, we need table prices. usd  We have already explored the fields in it.

We now want to build the SQL statement that helps us extract the latest Ethereum price.

need prices field and symbol field

The suggested SQL statement is the following:

SELECT price FROM prices.usd WHERE symbol = 'ETH' and blockchain is null ORDER BY minute desc LIMIT 1


Create a counter graph based on this query.

Now we created a query that helps us extract the Ethereum price and also built a graphic based on this query.

Ethereum Price (daily)

The suggested SQL statement is the following:


SELECT date_trunc('day', minute) AS day , AVG(price) AS price FROM 

 prices.usd 

WHERE symbol='ETH' and blockchain is null group by 1


Here we use the same table, "prices.usd."

Ethereum's total transactions

The suggested SQL statement is the following:


SELECT COUNT(*)/1e9 AS et_count FROM ethereum.transactions

we mean by 1e9 = 1000000000

-- 1e9 means 1 * 10 to the 9th power, which is 1 billion (1000000000).

select count(*)/1000000000 from ethereum.transactions


The query statement, as we can see, is easy and direct. We use count to extract the number of fields.

Ethereum transactions by week

The suggested SQL statement is the following:


SELECT

date_trunc('week', block_time) as week,

count(*) as Transactions

FROM

ethereum.transactions

WHERE block_time < date_trunc('week', NOW())

GROUP BY 1

ORDER BY 1


Ethereum smart contracts

The suggested SQL statement is the following:


SELECT COUNT(*)/1e6 as conts from ethereum.traces where type = 'create'

--SELECT count(*)/1000000 FROM ethereum.traces WHERE type = 'create'


Ethereum smart contracts this week

The suggested SQL statement is the following:


SELECT DATE_TRUNC('week',block_time) as week,count(*) as 

contracts_created

from ethereum.traces WHERE type = 'create' and block_time < 

date_trunc('week', NOW())

group by 1


Ethereum active addresses by day

The suggested SQL statement is the following:


select date_trunc('day', block_time) AS day,count(distinct "from") as 

active_addresses

from ethereum.transactions where date_trunc('day', block_time) < 

date_trunc('day', NOW())

group by 1


Gas price

The suggested SQL statement is the following:


select date_trunc('week', block_time) AS week,avg (gas_price/1000000000) as

 price_gas

from ethereum.transactions

where date_trunc('week', block_time) < date_trunc('week', NOW())

group by 1


Gas used

The suggested SQL statement is the following:


select date_trunc('week', block_time) AS week,avg (gas_used) as used_gas

from ethereum.transactions

where date_trunc('week', block_time) < date_trunc('week', NOW())

group by 1


Now build a dashboard.

We can build dashboards.

Just add the queries to the dashboard and coordinate and arrange.